8 ocak saat 15:20 ve kitabim geldi. Ty amazon.co.uk ty ups

8 ocak saat 15:20 ve kitabim geldi. Ty amazon.co.uk ty ups
taken from : http://www.howtoforge.com/installing-and-using-openvz-on-debian-squeeze-amd64
1- apt-get install linux-image-openvz-amd64 vzctl vzquota vzdump
2- ln -s /var/lib/vz /vz
3- nano /etc/sysctl.conf
[...]
net.ipv4.conf.all.rp_filter=1
net.ipv4.icmp_echo_ignore_broadcasts=1
net.ipv4.conf.default.forwarding=1
net.ipv4.conf.default.proxy_arp = 0
net.ipv4.ip_forward=1
kernel.sysrq = 1
net.ipv4.conf.default.send_redirects = 1
net.ipv4.conf.all.send_redirects = 0
net.ipv4.conf.eth0.proxy_arp=1
[...]
sysctl -p
4-nano /etc/vz/vz.conf
[...]
# Controls which interfaces to send ARP requests and modify APR tables on.
NEIGHBOUR_DEVS=all
[...]
5- reboot
6- uname -r
DONE !
PART II
1- wget -O - http://ovz-web-panel.googlecode.com/svn/installer/ai.sh | sh
2- http://you-host:3000
admin/admin
DONE!
🙂
1- systat -ifstat
2- netstat -I em3 -w 1
You can use editcap to split the file:
http://www.wireshark.org/docs/man-pages/editcap.html
First you can use capinfos to display statistics of the capture file:
http://www.wireshark.org/docs/man-pages/capinfos.html
capinfos -c displays the number of packets in the capture file:
$ capinfos -c test.cap
File name: test.cap
Number of packets: 511145
Next you can use editcap with the option -c to set the maximum number of
packets per output file.
In this example 100.000 packets per file. Each output file will be created
with a suffix, starting with -00000.
editcap -c
$ editcap -c 100000 test.cap split.cap
The following command displays the names of the created capture files and
the number of packets in each file.
$ capinfos -c split.cap*
File name: split.cap-00000
Number of packets: 100000
File name: split.cap-00001
Number of packets: 100000
File name: split.cap-00002
Number of packets: 100000
File name: split.cap-00003
Number of packets: 100000
File name: split.cap-00004
Number of packets: 100000
File name: split.cap-00005
Number of packets: 11145
This is mostly so I don’t forget about it myself.. when installing Ubuntu, don’t forget to add this line to ~/.bashrc and have Midnight Commander remember the last directory you were in on exit instead of taking you back to the one you were in when you typed mc in the shell:
source /usr/share/mc/bin/mc.sh
Run these commands
smartctl -a /dev/sda
smartctl -a /dev/sdb
If the value for Current_Pending_Sector is higher than 0 then you have some bad sectors.
If the value is quite low you could use hdrepair to repair the sectors.
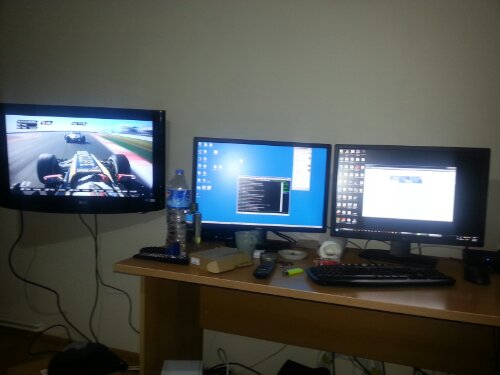
Bir kac gundur bu sistemle ugrasiyordum.
2 Monitor (Dell U2412M – 24″ IPS ekran ) + 1 Adet HD Ready LG 32″ TV
Hedef 3 unu extend ederek sistemi olusturmakti.
Sahip oldugum NVIDIA MSI GTX560TI TwinFrozer II OC edition kartimda NVIDIA nin kisitlamalari nedeni ile bunu yapamayinca ( NVIDIA tek GPU ile ayni anda sadece 2 cihaz calistirabilirsin diyor)
Kartimi AMD tarafinda Sapphire HD6950 2GB bir kart ile Takas etmek yoluna gittim
6950 Default ayarlarinda GTX560 TI kartimdan aziciak daha iyi sonuclar veren denk bir kart.
Yeni AMD kart geldikten sonra su konfigurasyon ile islemi tamamladim
Monitor 1 Mini Display Port ile karttan cikiyor Kartin kutusundan cikan adaptor ile normal Display Port oluyor ve baglaniyor
Monitor 2 Standart DVI kablosu ile Kartin DVI cikislarinin ust tarafindakine takili
TV Standart HDMI olarak bagli
Sonuc her 3 monitordu de extend edebiliyorum su an
Bir yanda Tv + 2 Monitor
Guzel ve arzu ettigim bir setup oldu 🙂
NOT: 6950 Geldikten sonra bu kartin cok basit bir BIOS upgradei ile 6970 Olarak calistirilabildiginide farkettim.
Gerekli bilgi asagidaki linklerde var:
Bana Daha cok hiz veya 6970 Lazim olmadigindan su an islemi yapmiyorum. Ama belki ilerde yaparim bende 6950@6970 olayini.
http://www.techpowerup.com/articles/overclocking/vidcard/159
http://www.legitreviews.com/article/1608/5/
http://blog.daum.net/victorys/11153513
1- sistem geri yuklemeyi kapat
2- sanal bellek kapat > bilgisayar > ozellikler > gelismis sistem ayarlari > gelismis sekmesi > performans > ayarlar > sanal bellek
3- trim kontrol
cmd > fsutil behavior query disabledeletenotify
DisableDeleteNotify = 0 TRIM Aktif demektir.
DisableDeleteNotify = 1 TRIM Kapalı demektir.
4- ssdye ozellikler > indexing servisi kapat
Use these scripts to collect bandwidth data for each container. You can view the data on a graph and total usage by months.
The scripts are originally received from Hutzoft but modified to work with the Proxmox directory structure.
1. Install rrdtool and PHP support
apt-get install rrdtool php5
2. Download the bandwidth collection script and Web UI
wget http://www.aip.im/downloads/vzmonitor.tar.gz
or
wget http://www.shukko.com/vzmonitor.tar.gz
3. Unpack and relocate
tar zxvf vzmonitor.tar.gz
mkdir /usr/local/bandwidth
mv bandwidth.sh /usr/local/bandwidth/
chmod +x /usr/local/bandwidth/bandwidth.sh
mv vzmonitor /var/www/
4. Create a cron job to collect the data every 5 minutes (crontab -e)
*/5 * * * * cd /usr/local/bandwidth;./bandwidth.sh &> /dev/null
5. Add config to Apache (pico /etc/apache2/conf.d/vzmonitor.conf)
Alias /vzmonitor /var/www/vzmonitor

<Directory /var/www/vzmonitor>
DirectoryIndex index.php
</Directory>
6. Restart Apache
/etc/init.d/apache2 restart
7. It’s ready, wait a few minutes and enter this location to view the bandwidth usage: http://yourserver/vzmonitor
FDT is an Application for Efficient Data Transfers which is capable of reading and writing at disk speed over wide area networks (with standard TCP). It is written in Java, runs an all major platforms and it is easy to use.
FDT is based on an asynchronous, flexible multithreaded system and is using the capabilities of the Java NIO libraries. Its main features are:
FDT can be used to stream a large set of files across the network, so that a large dataset composed of thousands of files can be sent or received at full speed, without the network transfer restarting between files.